Home / space resource / The colour of stars

The colour of stars

Learn why stars have different colours and how colour relates to temperature. A curriculum-aligned astronomy resource for NZ students and teachers.

This activity is part of our live SpacewardBound sessions delivered in schools across New Zealand.

Earth & Space Science
Astrophysics
20–30 mins reading or 30–45 mins with discussion
Article

These resources are built from real questions asked by over 40,000 students during our visits to 200+ New Zealand schools.

Prior knowledge

Students should understand basic concepts of light, including spectra and how light carries energy, as well as the idea that stars emit light.

Learning outcomes

    If you’ve looked up at stars, you may have noticed their colour varies. Some stars appear to be slightly orange, others blue, and some appear to be white. The colour variation is quite subtle to our eyes, and we see the combined emission across the visible spectrum of light from that star. You would see a distribution if you measured light intensity at different wavelengths and graphed it. Wilhelm Wien discovered a relationship between light intensity at different wavelengths for an object and its temperature. Assuming that an object is a perfect emitter that doesn’t absorb any radiation, we can make a nice curve on a graph for any given temperature. We call this a black body radiation curve. Of course, objects are not perfect emitters, and depending on what they are made of, there will be bumps in the black body radiation curve where certain atoms and molecules absorb the radiation and even absorb and re-emit the radiation at different wavelengths.

    Black body distribution of radiation

    The graph below depicts the blackbody emission for a star at the temperature in the title. It starts with the Sun at 5777K. At that temperature, we see the peak emission at about 502nm in the green part of the spectrum. The curve is coloured to show where the visible part of the electromagnetic spectrum is. You can adjust the temperature with the slider above the graph; moving it to the right will increase the temperature, and moving it to the left will decrease the temperature.

    To the right of the graph is a coloured circle that simulates what a star would look like to a human eye. It averages the intensity of light in the visible spectrum for that temperature. This will take on a blue hue for higher temperatures, and for cooler temperatures, it will be redder in hue.

    The graph uses Planck’s Law of Black Body Radiation:

    A deep sky photo of cluster NGC 5617, representing stars
    This is the Open Cluster NGC 5617 showing some of the subtle variation in star colour typical of an Open Cluster. The image was taken by the author using the Chile Slooh telescope.

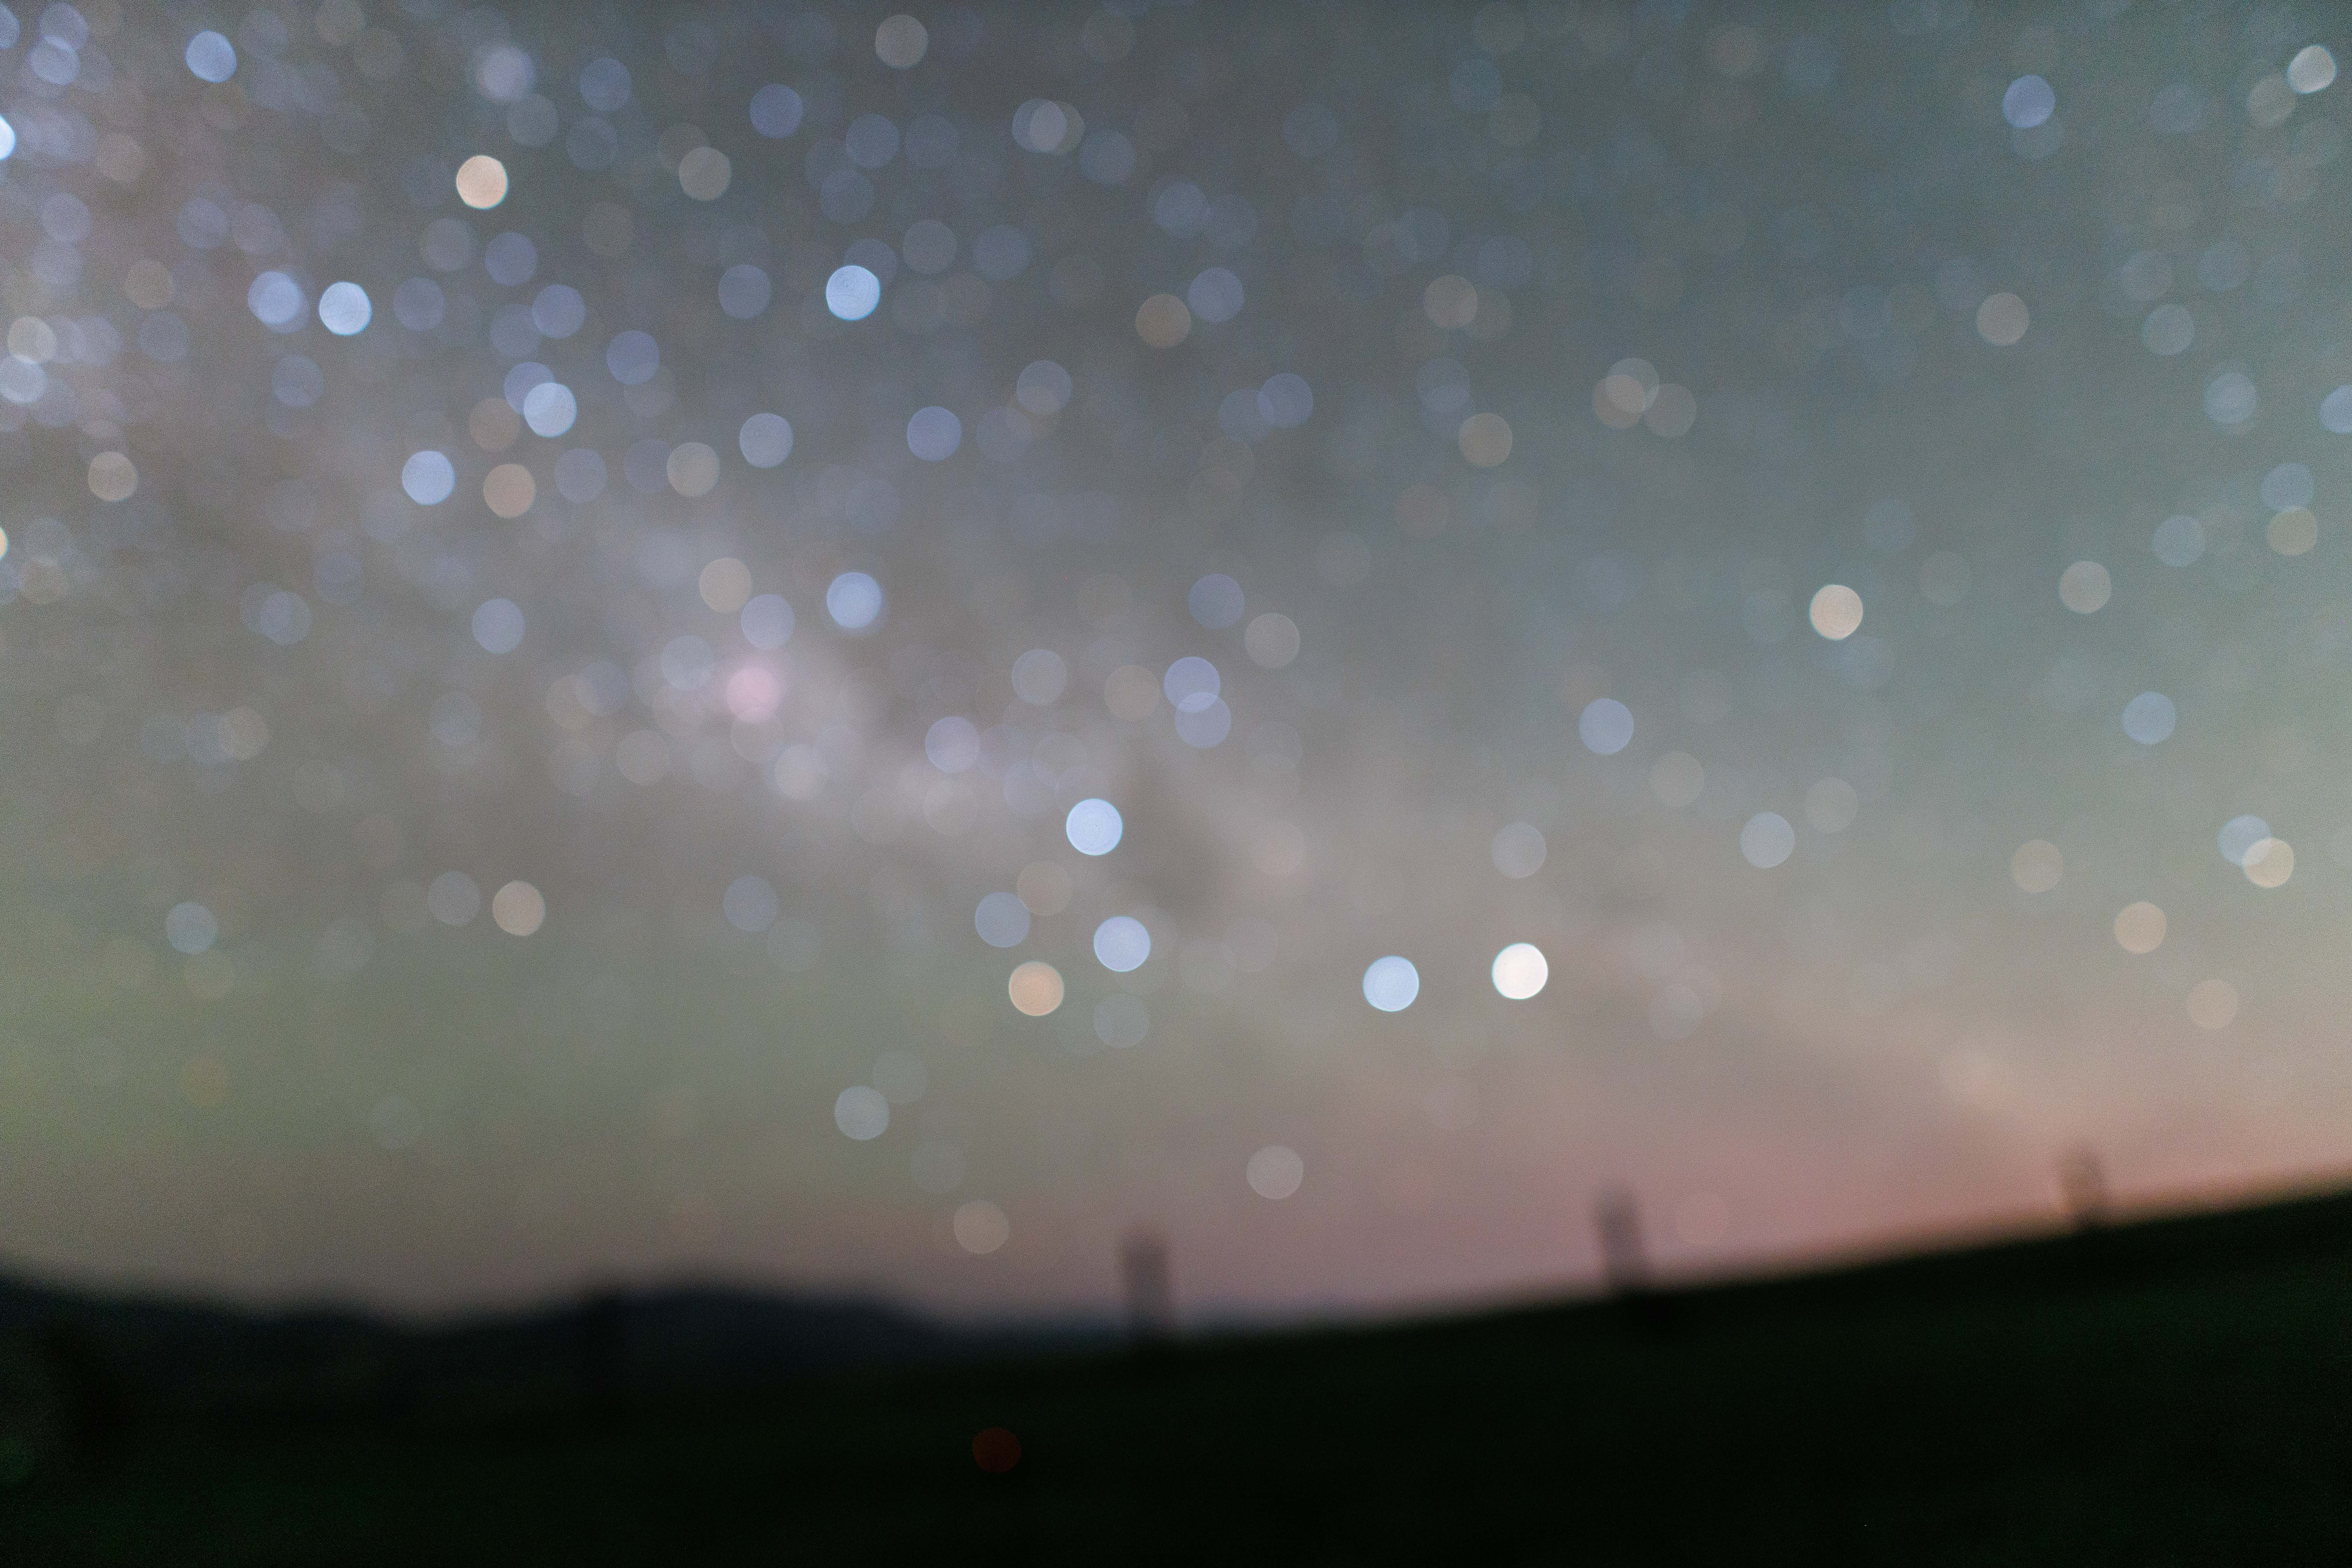
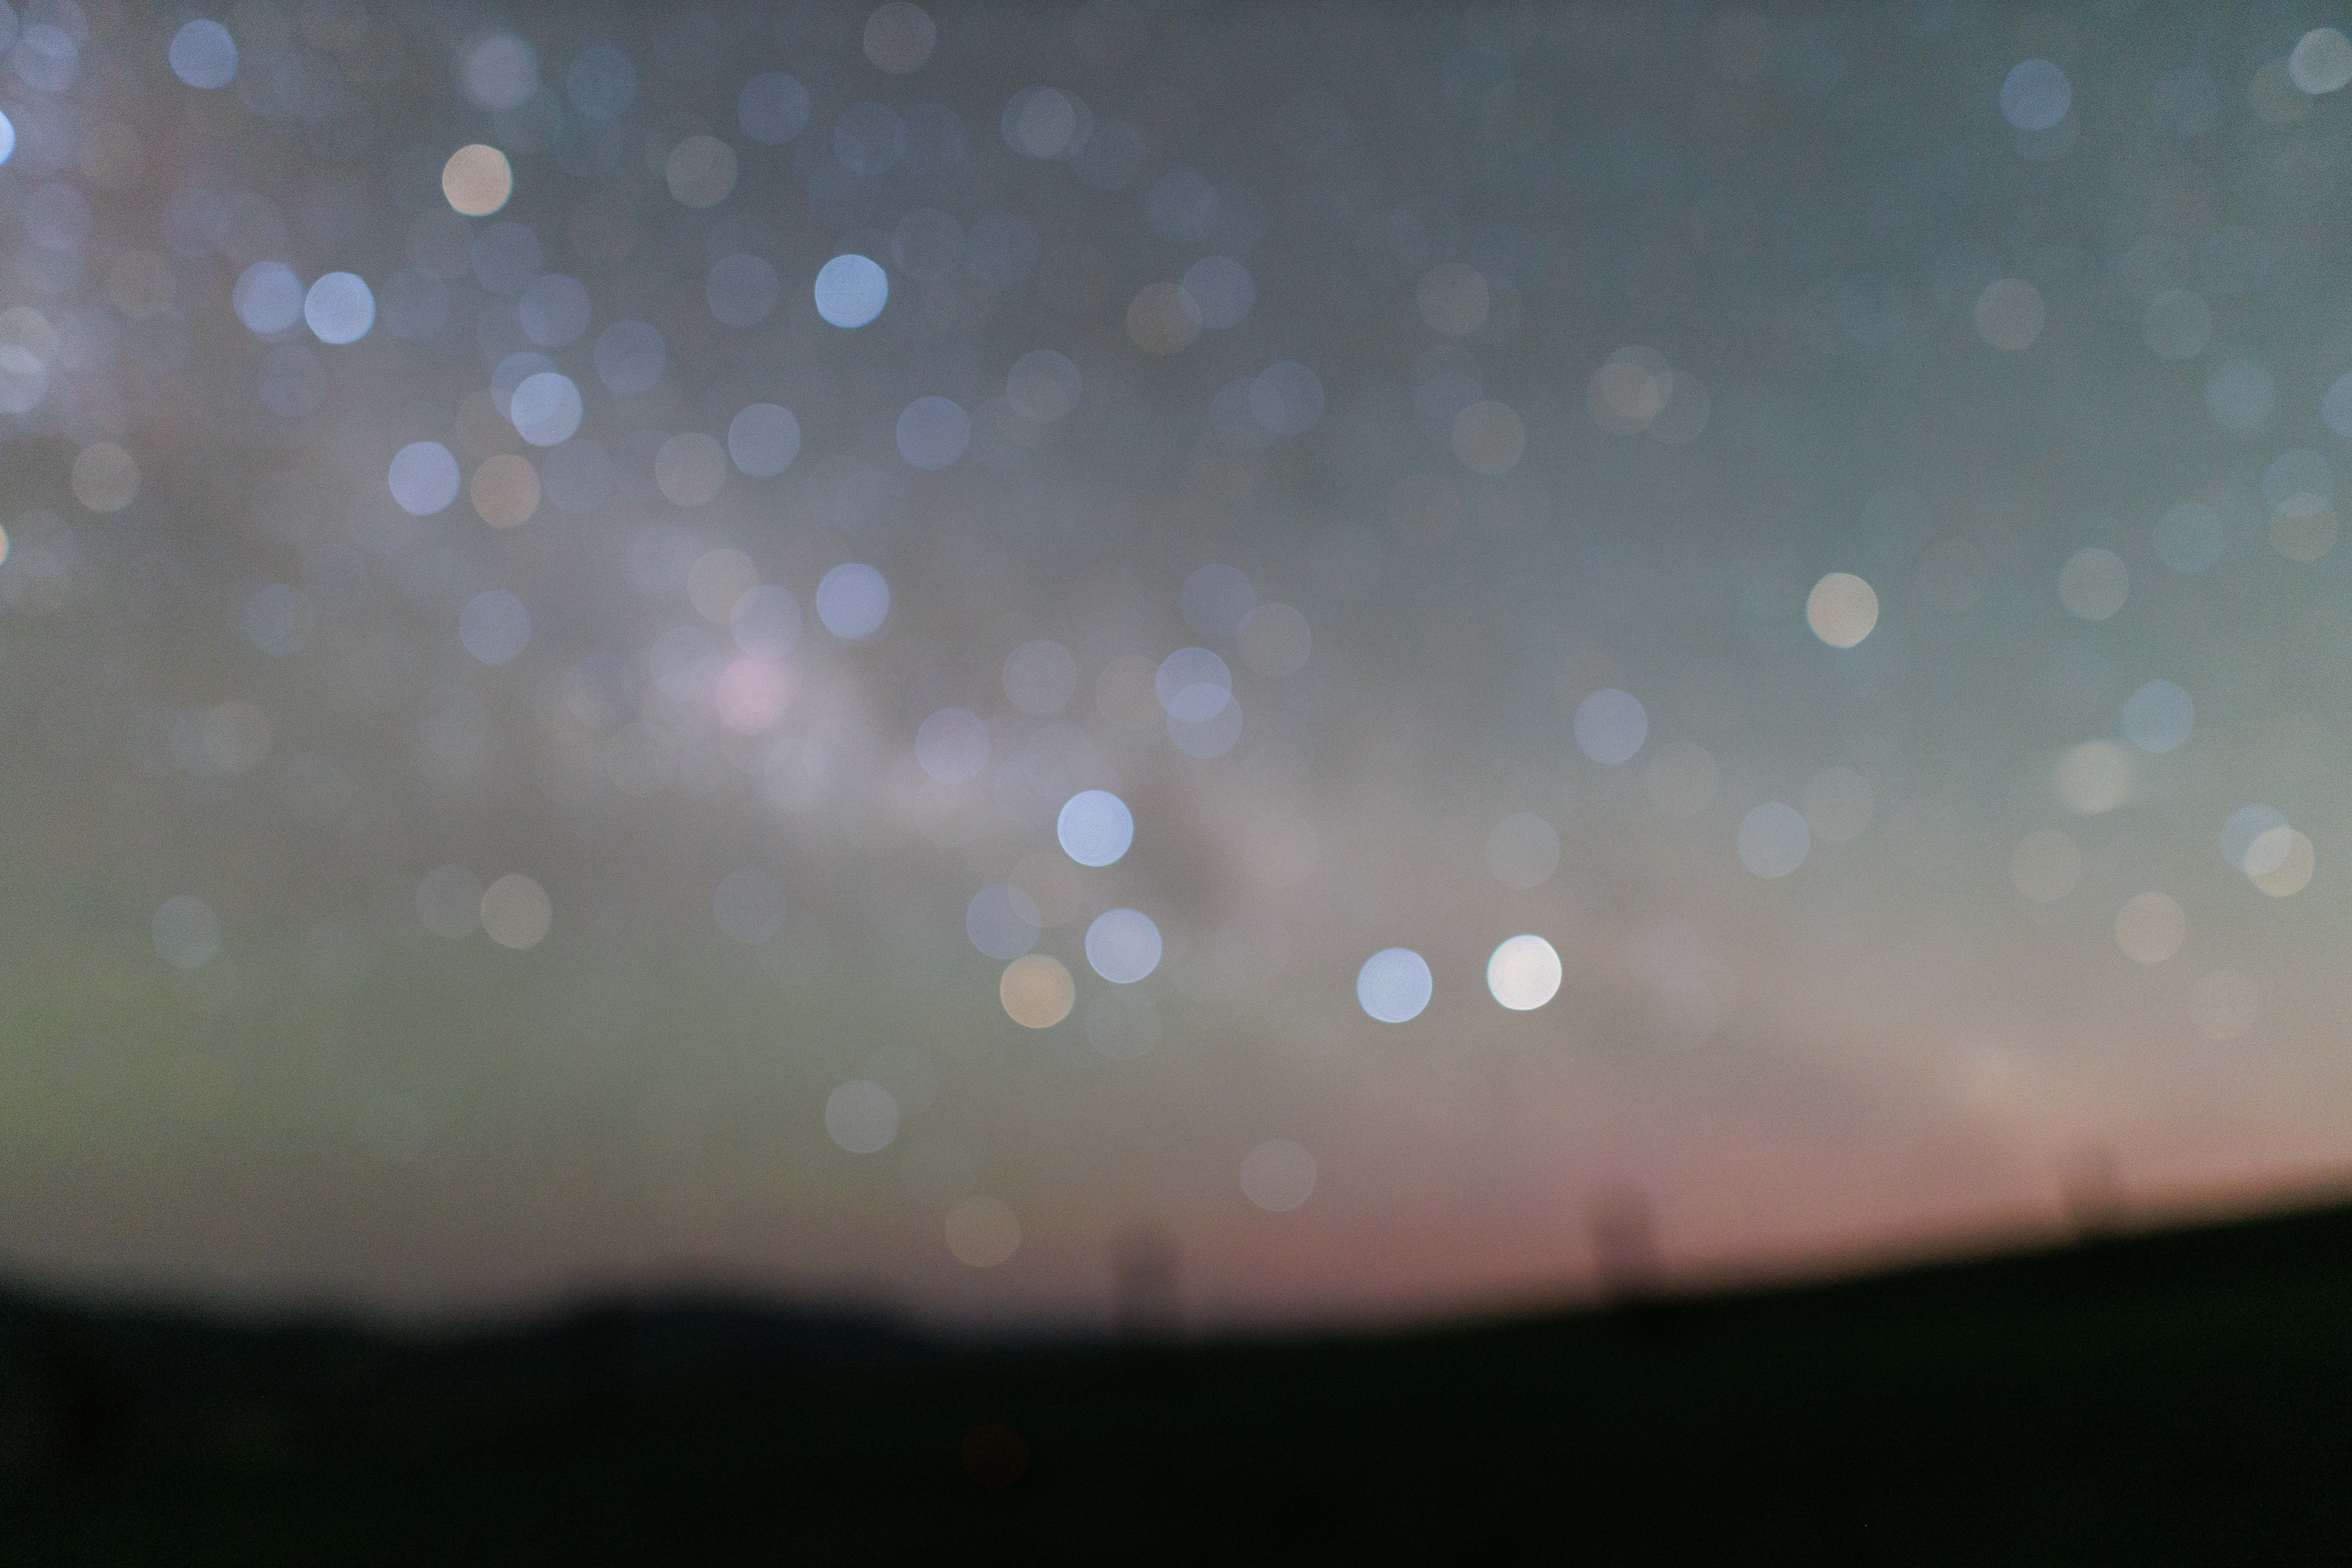
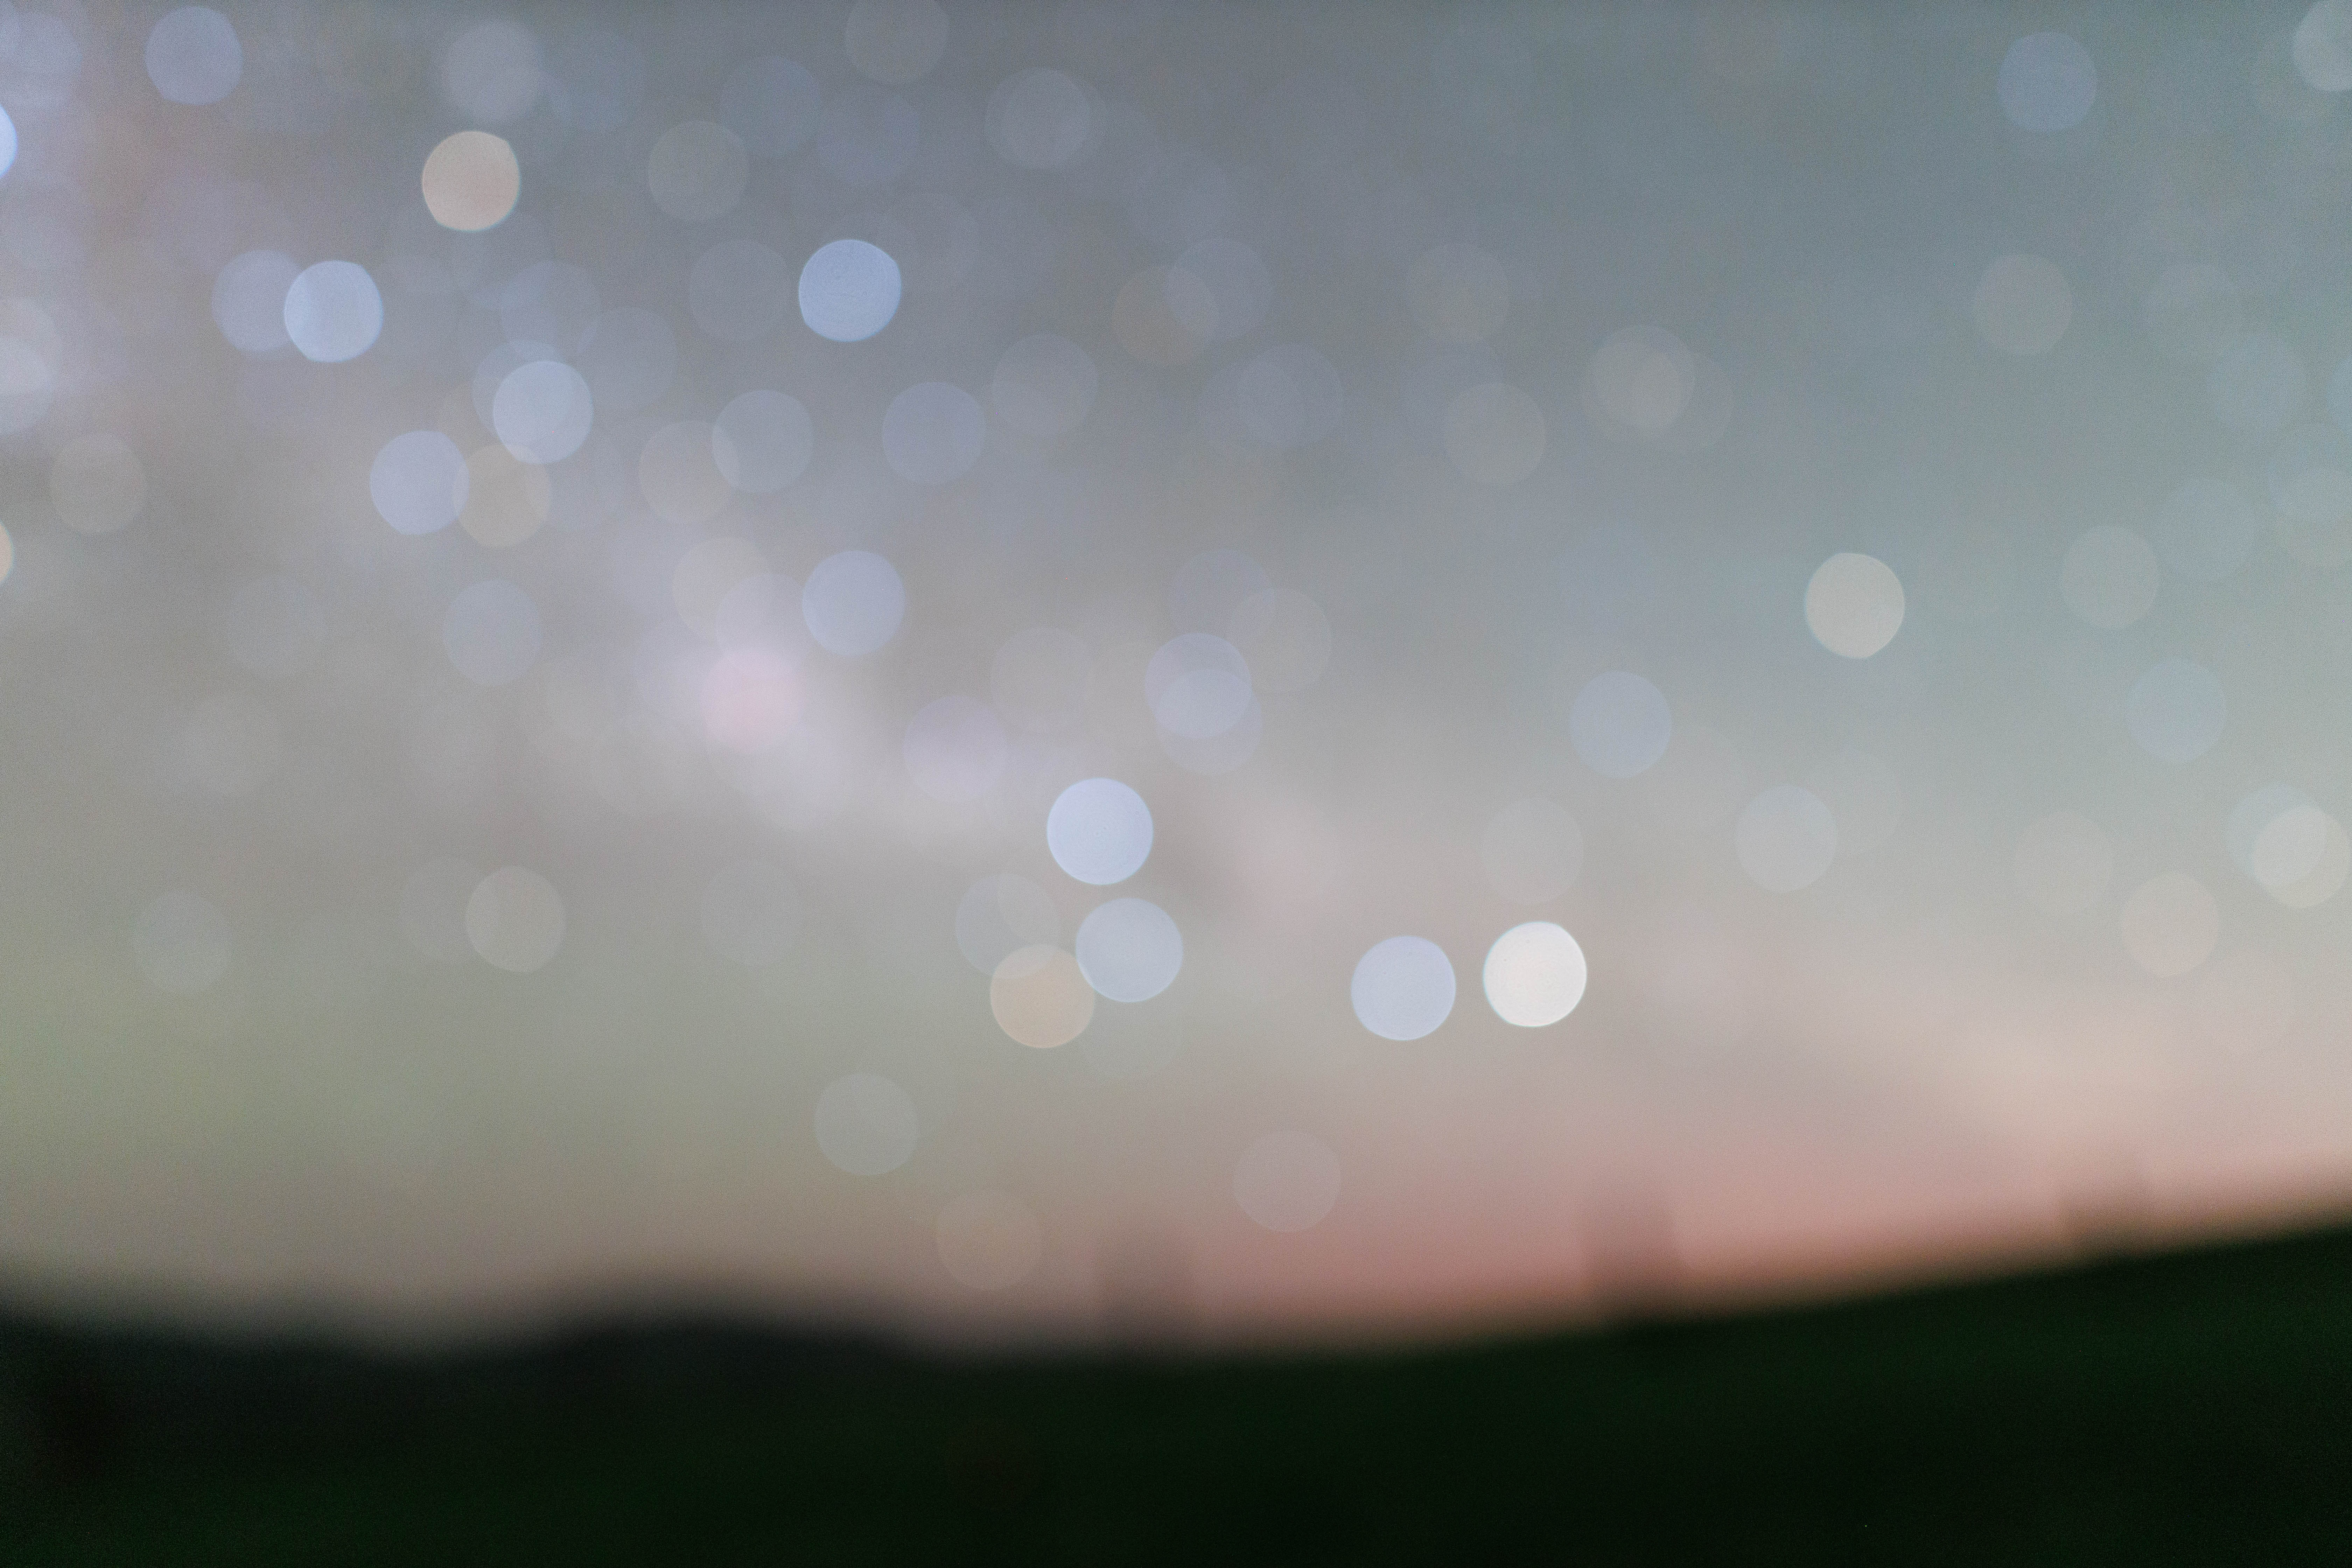
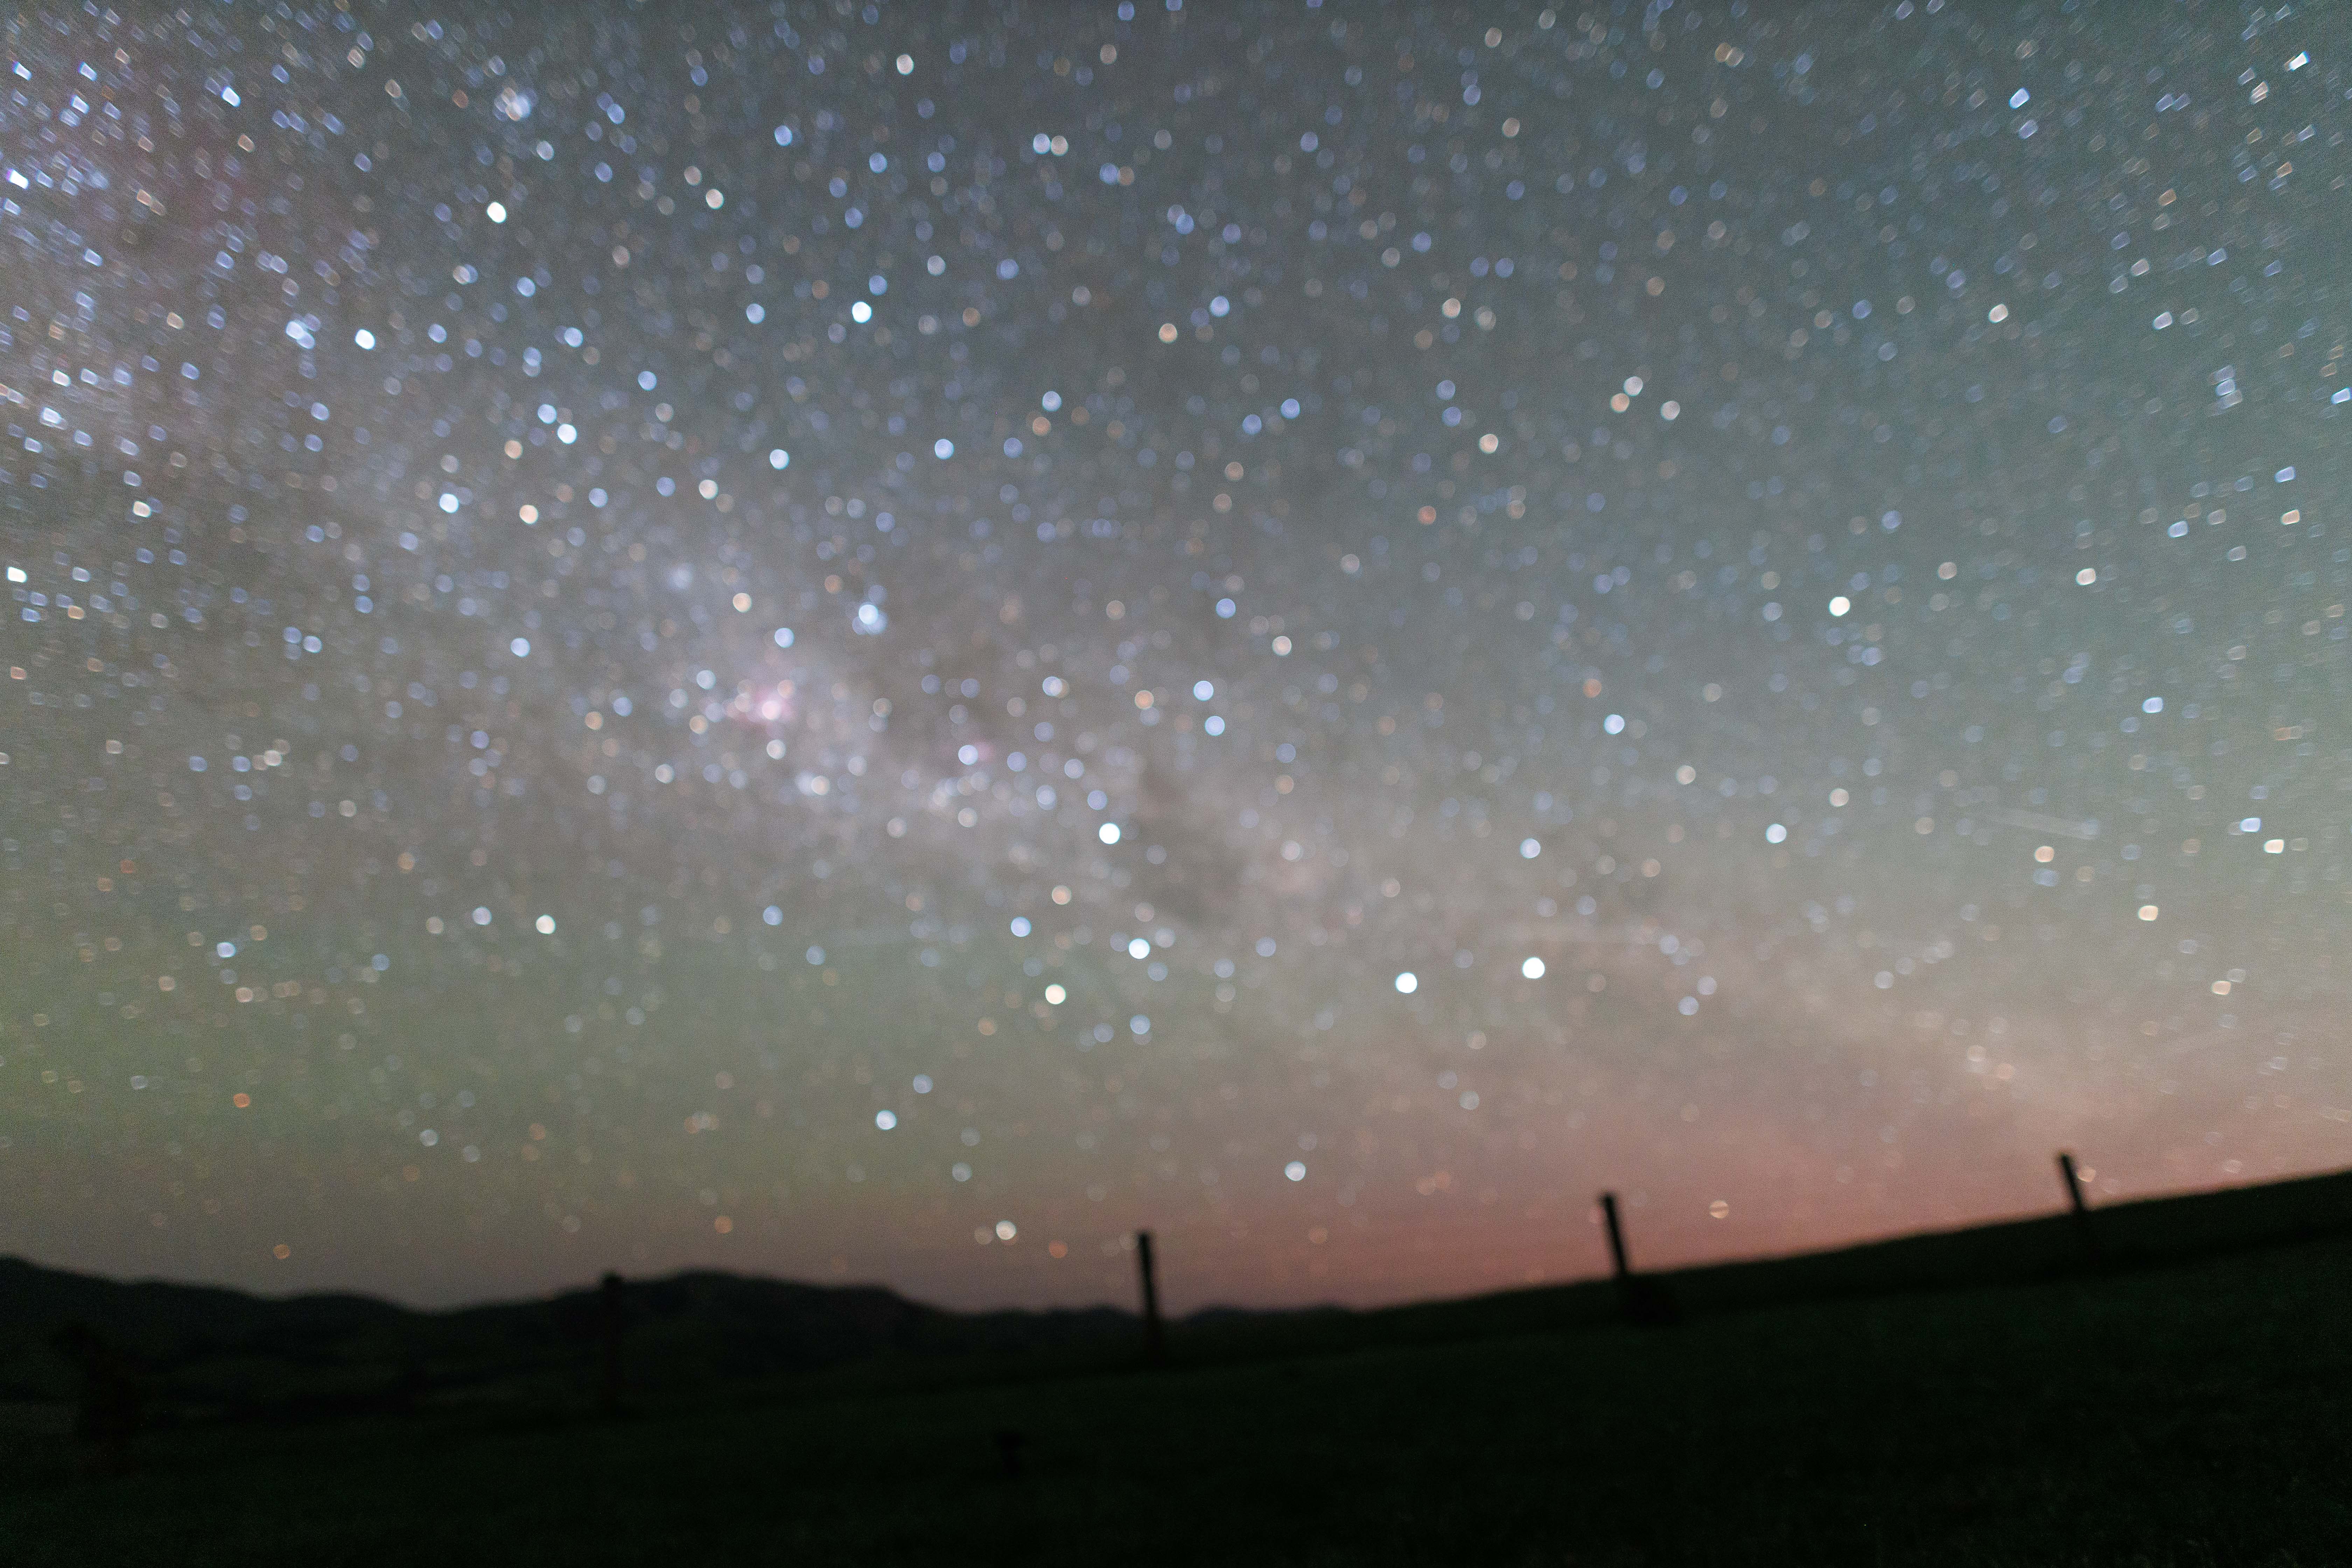
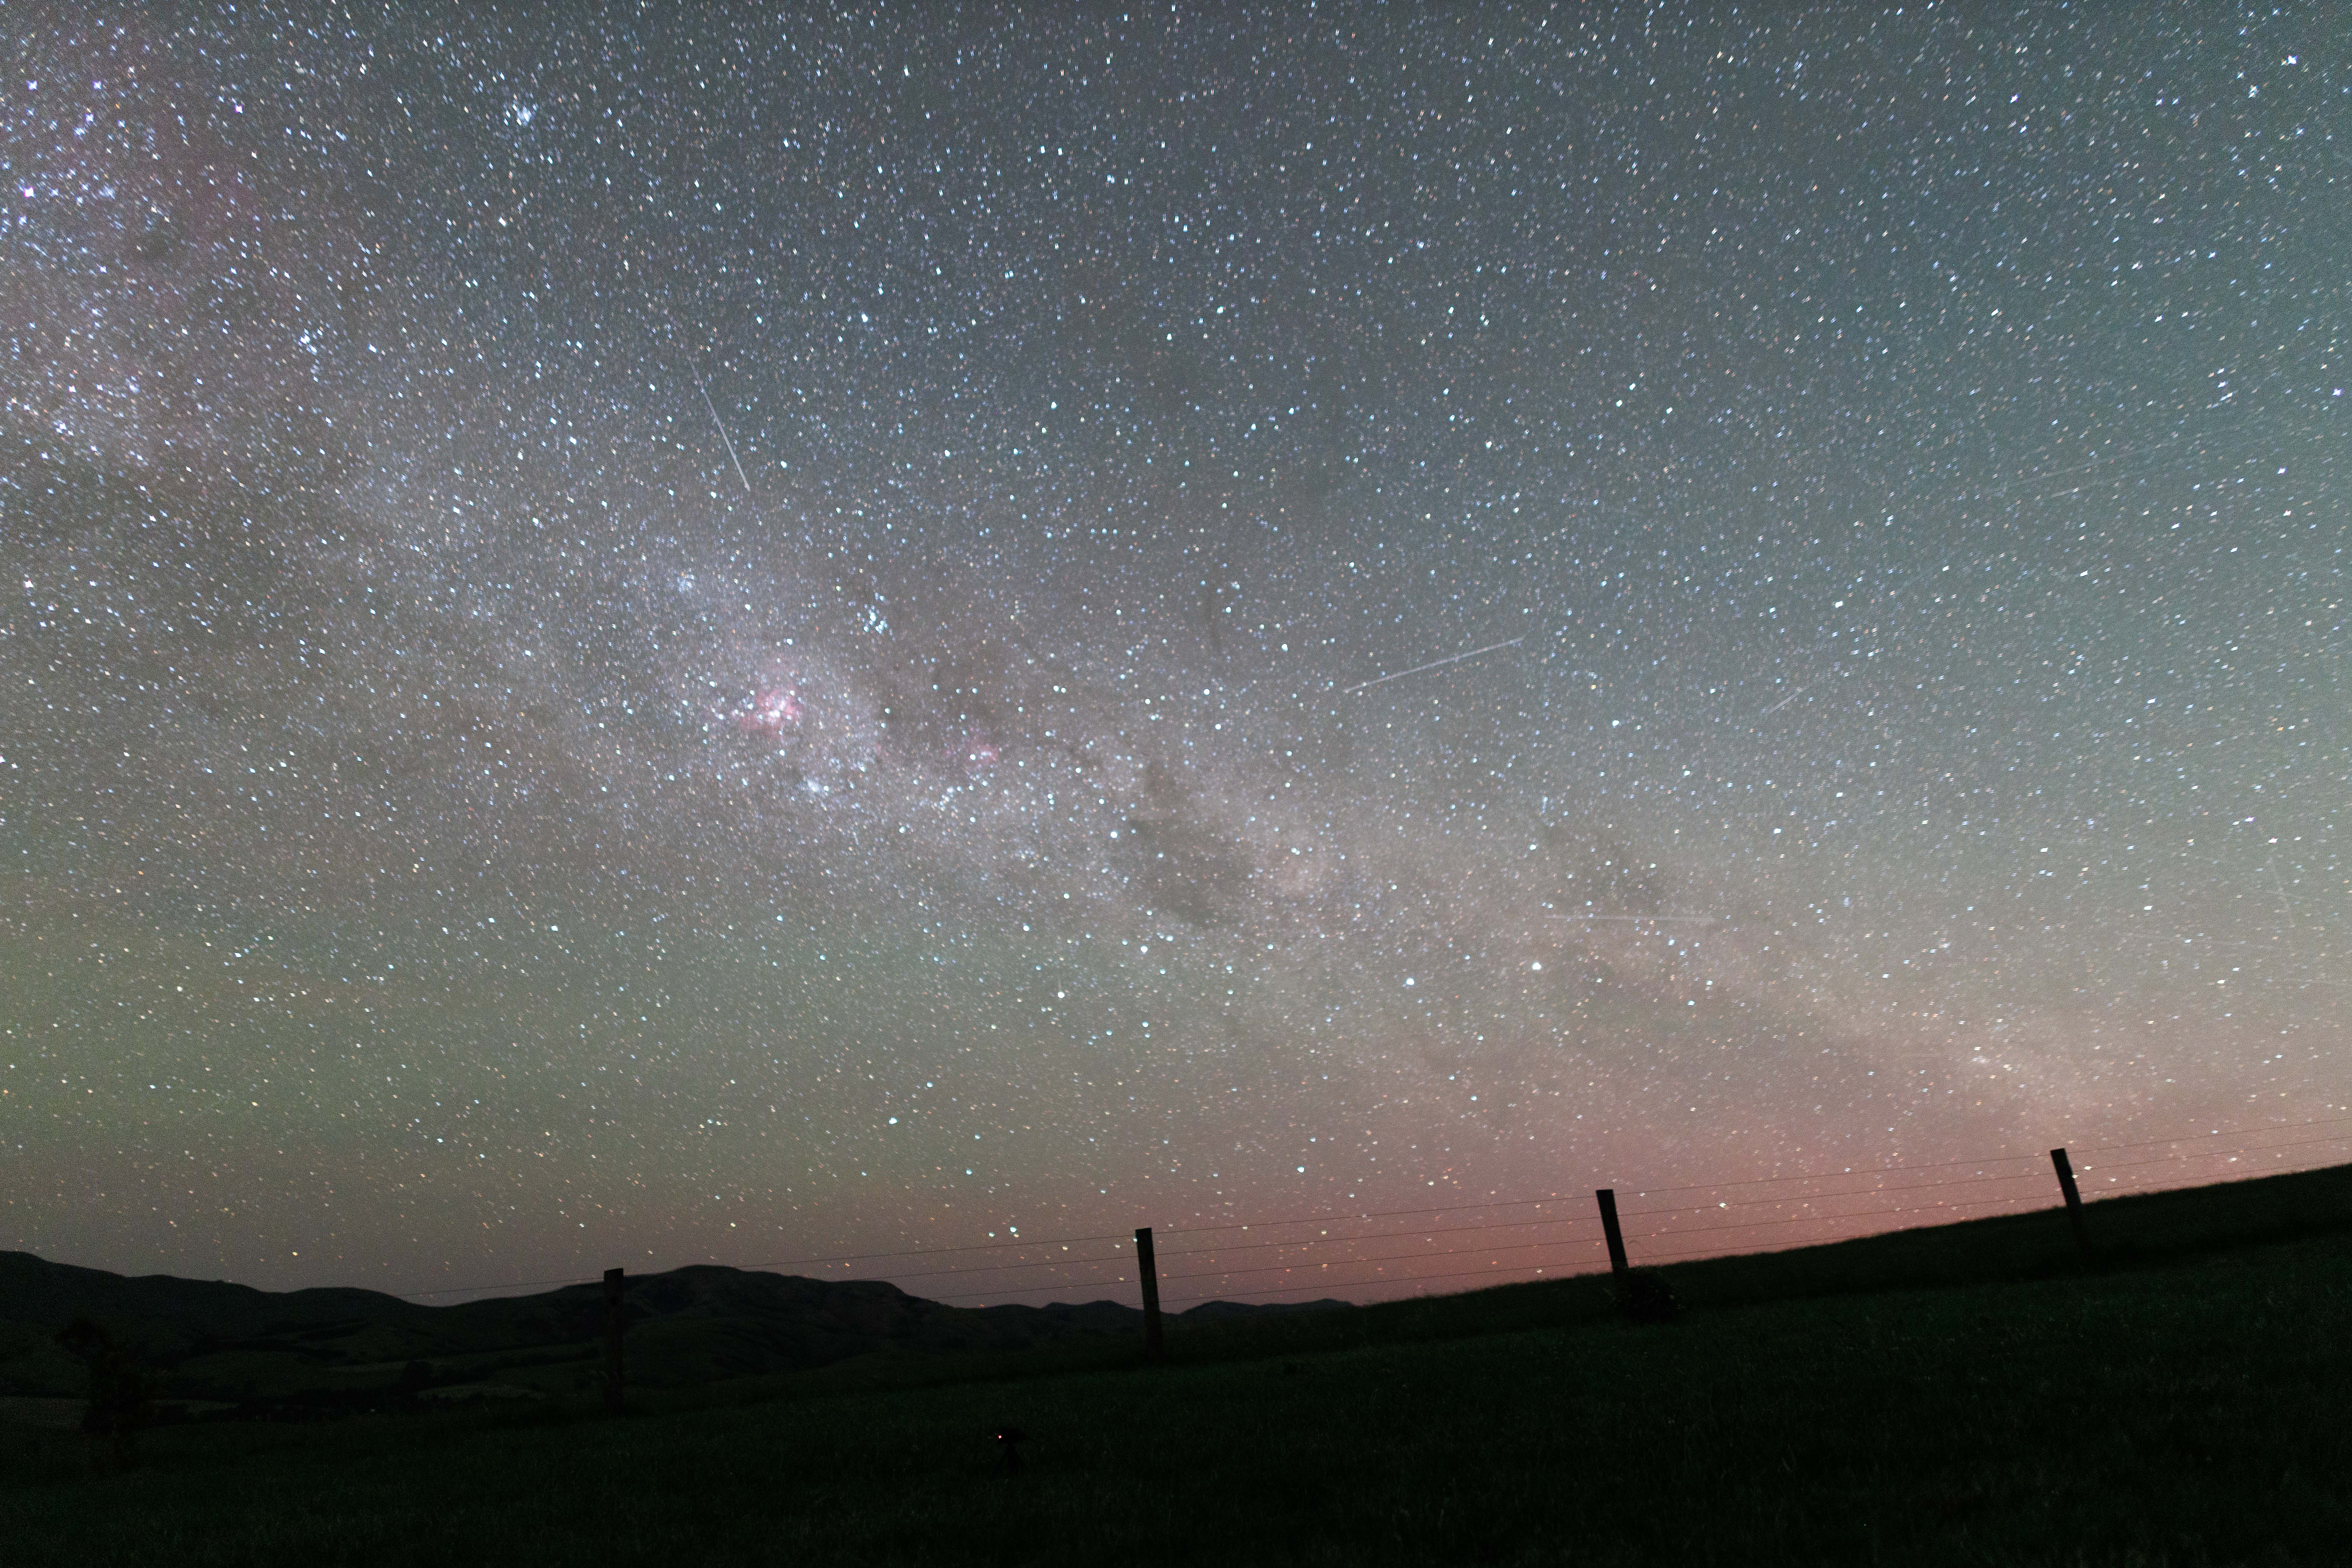
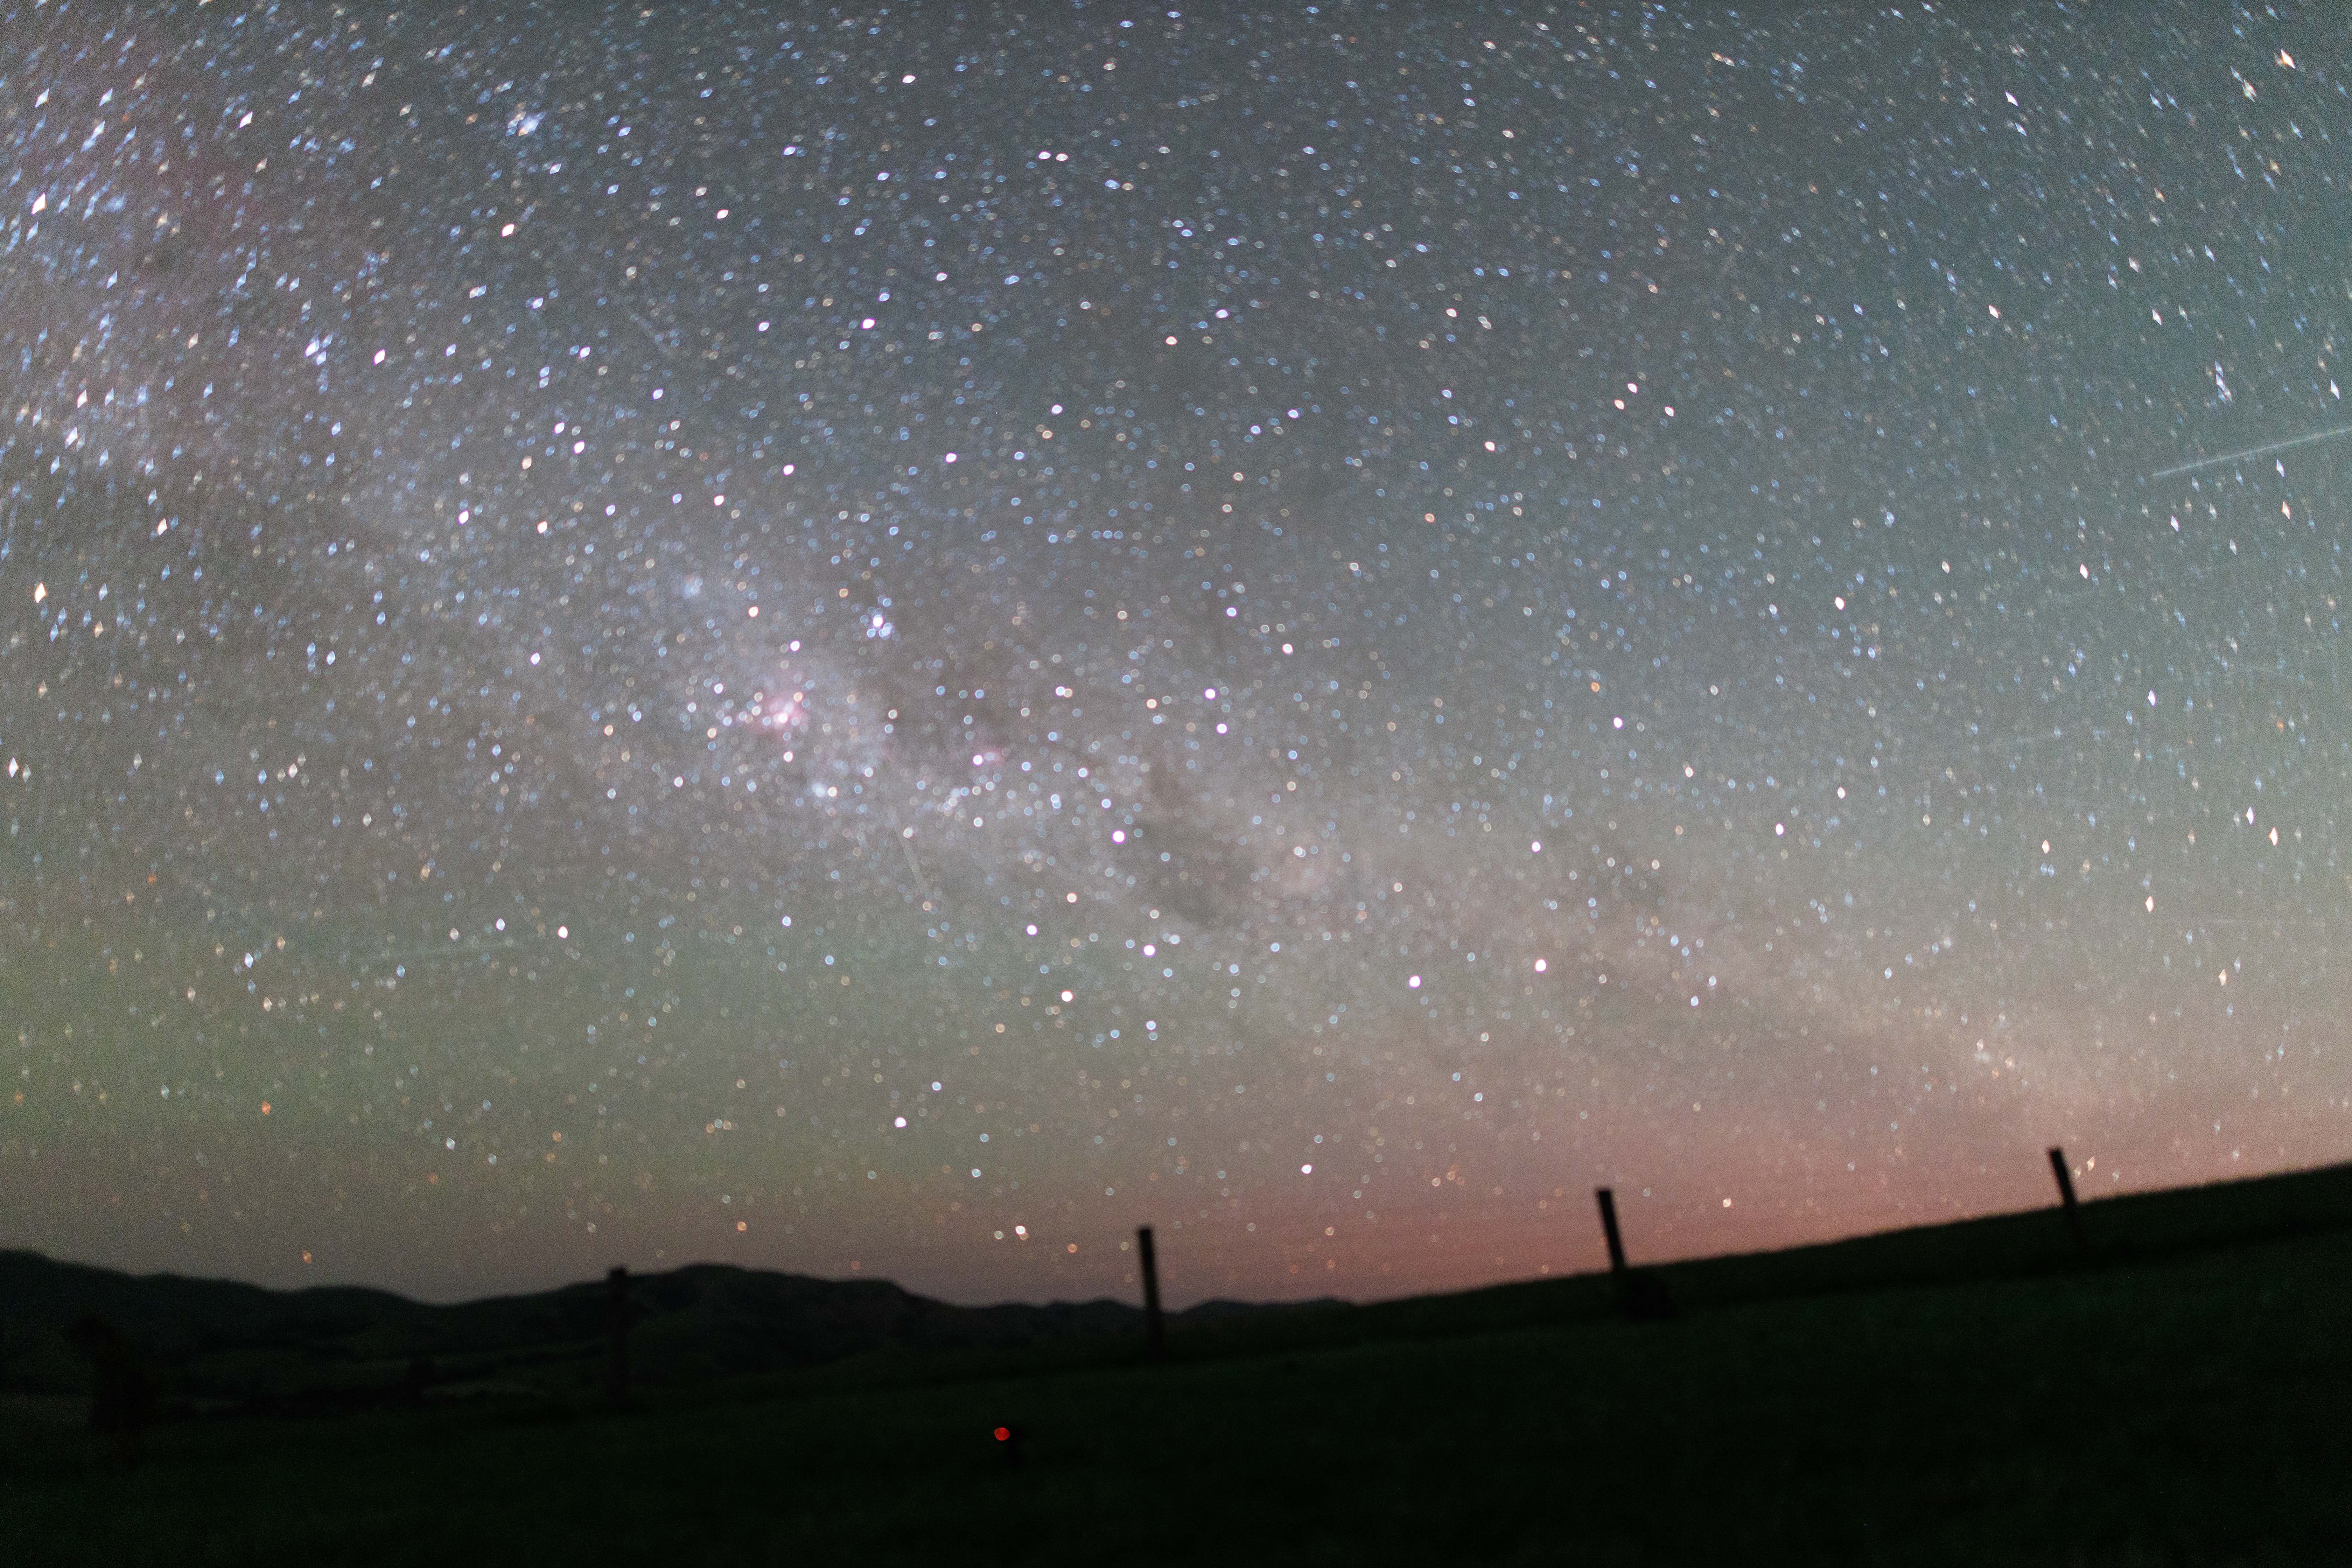
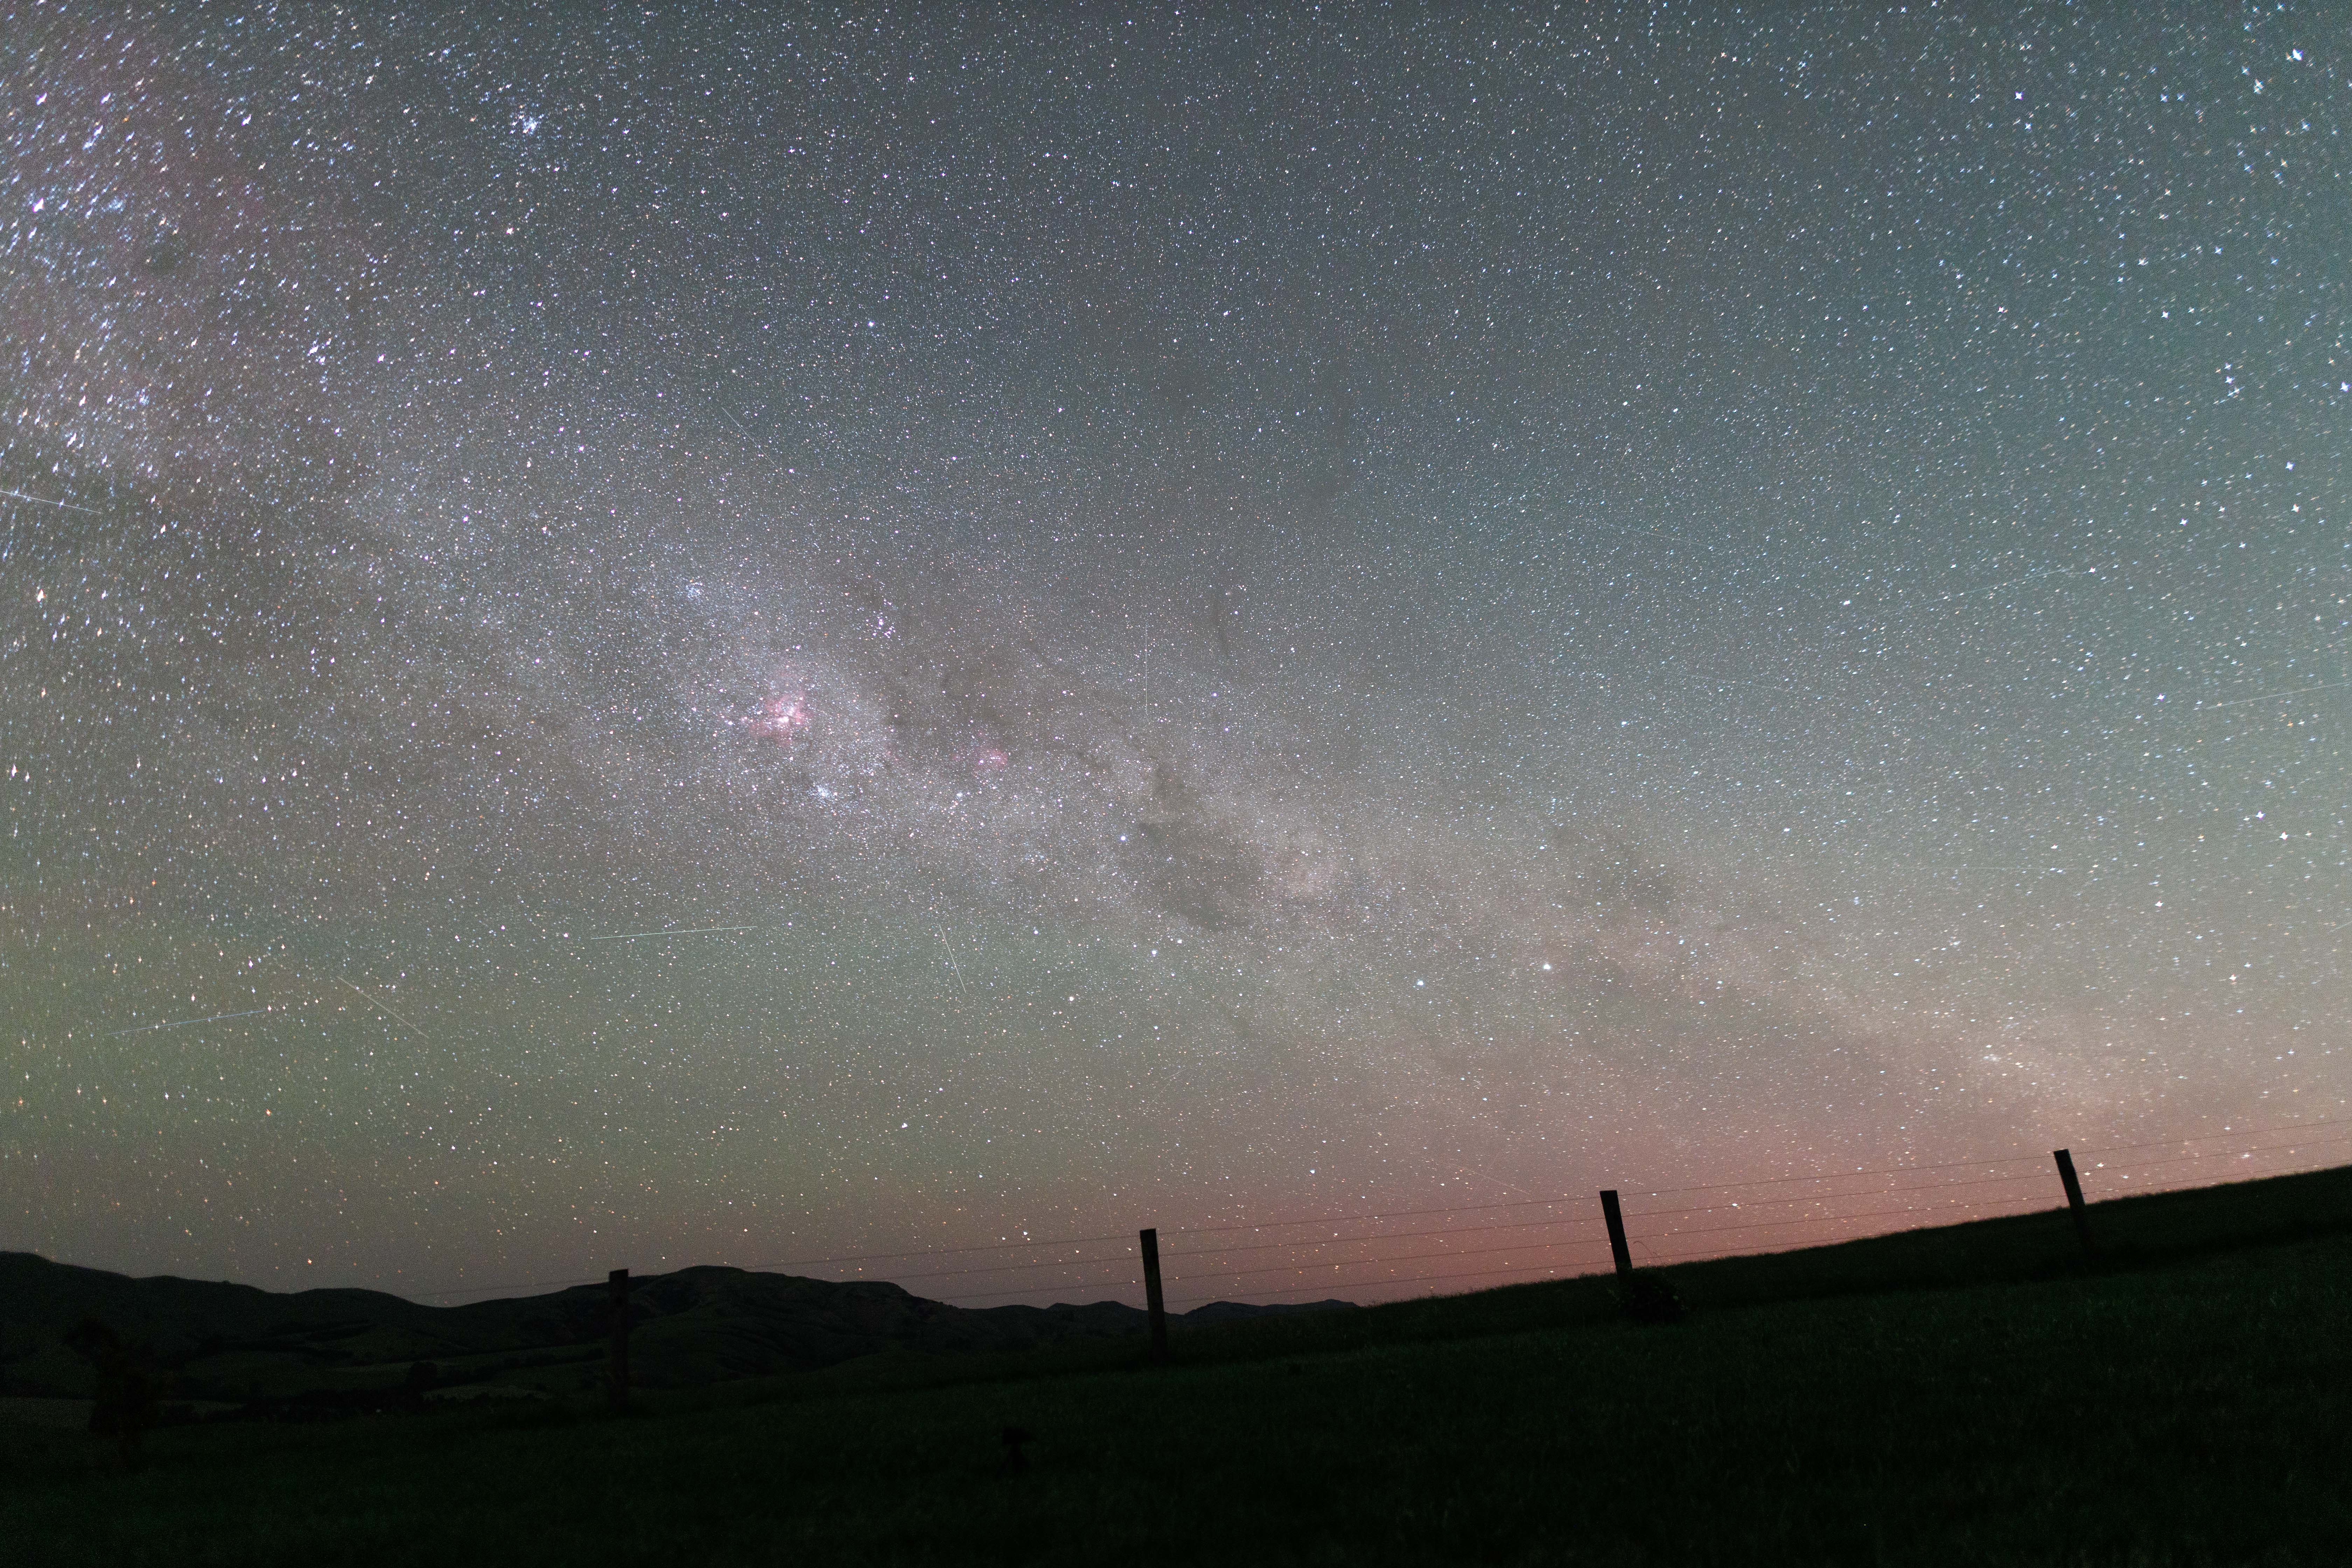
    Examples of various stellar regions visible from the Dark Sky Reserve of Wairarapa

    Photos taken at our Star Safari Observatory in Wairarapa.

    Camera: Canon Ra, with Sigma Art 24 lens, 1.4, exposure 20 sec, 3200 ISO Images are unprocessed.

    The bright band of the Milky Way we see from Orion to the Southern Cross is our view along the galaxy’s disk from within the Orion Arm. In this image, the stars have been slightly defocused to make their colours easier to see. Each blurred point represents a star, and the colour differences reflect variations in temperature. Blue stars are hotter, while red stars are cooler. This is the same principle used by astronomers to study stars.

    We take concepts like this and turn them into interactive, hands-on learning experiences students actually understand.

    We’ve worked with 200+ schools and 40,000+ students, helping make complex space science understandable and engaging. We built these resources from the questions we got from the students and teachers. 

    Teach this tomorrow. Or we’ll bring it to your classroom.

    This activity is part of our live SpacewardBound sessions delivered directly in schools. We run it as a full interactive experience using our mobile planetarium and hands-on activities.

    Used by schools across New Zealand

    Visiting schools across New Zealand to deliver curriculum-aligned astronomy and space experiences.

    Are you a teacher?

    Stay Ahead in Space Education!

    Subscribe to our newsletter to early access innovative teaching materials, space mission insights, and New Zealand curriculum-linked resources.